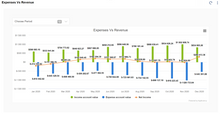
The A4C Project Dashboard, is a powerful visualization tool provided by Appficiency. It enhances the functionality of the A4C Job Costing (JC) module by offering clear and intuitive visual representations of JC metrics that impact the financial performance of your construction projects. This dashboard empowers Appficiency clients to analyze and understand job costs at various levels, such as activity, budget, and cost type, enabling more informed decision-making and understanding vital project metrics such as budgeted costs and revenues versus actuals, work in progress and total budget at completion, allowing business managers such as Project managers, CEOs and CFOs to ensure maximal visibility and control.
Introduction
In the world of construction, data-driven decisions and real-time project insights are key. That's where the Construction Project Dashboard, steps in revolutionizing project management by offering a clear, visual representation of vital project metrics.
A4C Project Dashboard (PD) is designed to empower Appf clients to take full control of their projects by providing a user-friendly interface that enables a deeper understanding of project health and performance.
Whether you're overseeing a single construction project or managing a diverse portfolio, PD offers versatility and customization. It includes out-of-the-box KPIs for quick insights, but it also allows for the creation of custom KPIs, chart types, and data series. This adaptability makes it an invaluable asset for organizations with unique project management needs.
Benefits
The A4C Project Dashboard simplifies the complex world of construction project management, offering a clear path to project success. It is a must-have tool for construction professionals looking to harness the power of data and visualizations for more efficient, informed, and successful projects.
- Data Visualization
- KPI tracking
- Global KPIs
- Multi project comparison
- Efficient Decision making
- Customization to tailor the dashboard.
Use Cases
- Project performance monitoring by tracking KPIs such as profit to date, billings, cost trends, completion percentage and actuals costs by costs types enabling Appf clients make real-time adjustments to ensure project stay on track and within budget.
- Customized Project Metrics, allows A4C Project Dashboard to adapt to the needs of any company through fully customizable metrics and visualization tailoring the dashboard to their unique needs.
- Efficient Decision-Making, with easy to comprehend visuals and fully customizable dashboard, identifying potential issues, discrepancies or areas of improvement can easily be detected and leads to more informed and efficient decision making reducing costs and optimizing resource allocation
Key Features
- Data visualization to expedite decision making process
- Visualization on the most common industry KPIs such as,
- Profit to date
- Billings to date
- Cost Trend
- Percent complete
- Actual cost per cost type
- Custom KPI support to match the needs of any company where pre-defined KPIs do not cut it.
- Flexible Chart Setup, with options to customize chart types, chart sizes and even stack metrics.
- Multiple project support through global metrics.Each KPI is considered a global metric applicable to all projects, and their visuals are specific to individual projects. This means that you can use these metrics to evaluate and compare various projects seamlessly.


